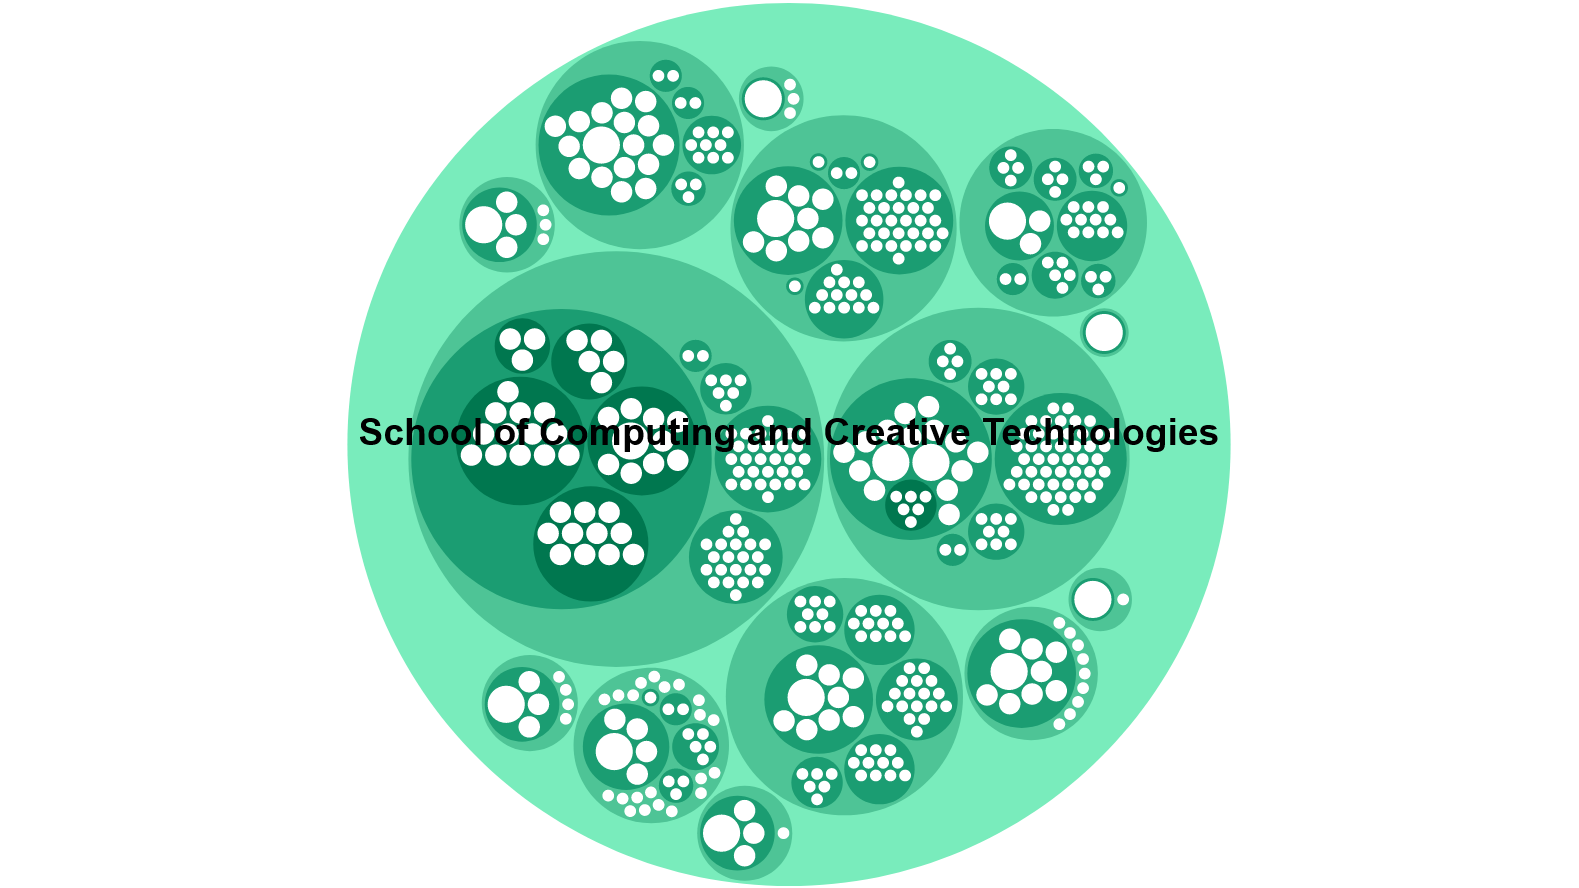
Interactive Data Visualisation
Developed for a client, this interactive data visualisation showcases the different
faculties and research outputs of UWE Bristol's School of Computing and Creative Technologies.
Users can click on bubbles, and see information about different faculties, including published
research, leads and contacts, and the relative scale of the faculty.
Developed in D3.js, this project was showcased on touch-screen TV's throughout UWE Bristol's
Frenchay Campus. Please click the 'Demo' button to interact with the visualisation.